
This article explains what's the Comparison View Dashboard and how to use it
Access Comparison View Dashboard by clicking the Comparison View icon in the Explorer section to compare the selected timeframe, to any other period.
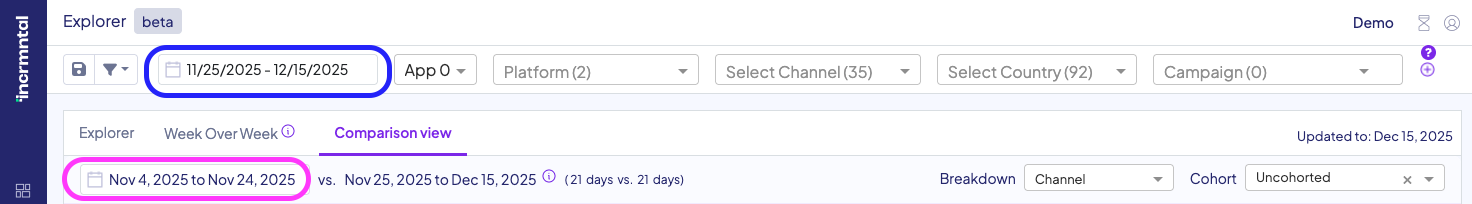
The Comparison Dashboard allows you to compare the selected timeframe, with any period prior to it.
Use the date picker in the top row to choose the primary timeframe you want to analyze. Then, in the row below, select any earlier comparison period. In that same row, you’ll see how many days are included in each timeframe you’re comparing.
You can see the difference in spend level and in your KPI values in comparison to the previous period.
If you had different marketing strategy in June, you can instantly compare what this brought you in terms of your KPIs in comparison to May. You can easily track on the weekly basis what it the current trend of your marketing performance.
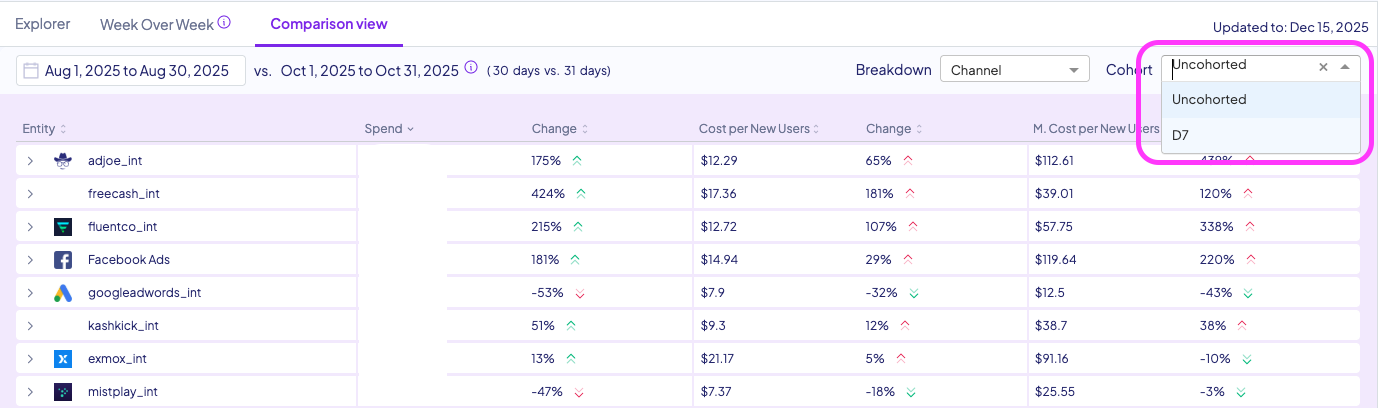
You can select different cohorts for your KPIs from the drop-down menu. You also can select Channel, country, platform or Campaign view from the breakdown
For any question please contact integrations@incrmntal.xyz , or open a support Ticket here